EIOPA and EUSPA harness Copernicus data to strengthen the supervision of extreme weather events
Satellite Intelligence in the Insurance Sector: Insights from the EUSPA-EIOPA White Paper
1. Introduction: The Shifting Landscape of European Natural Catastrophe Risk
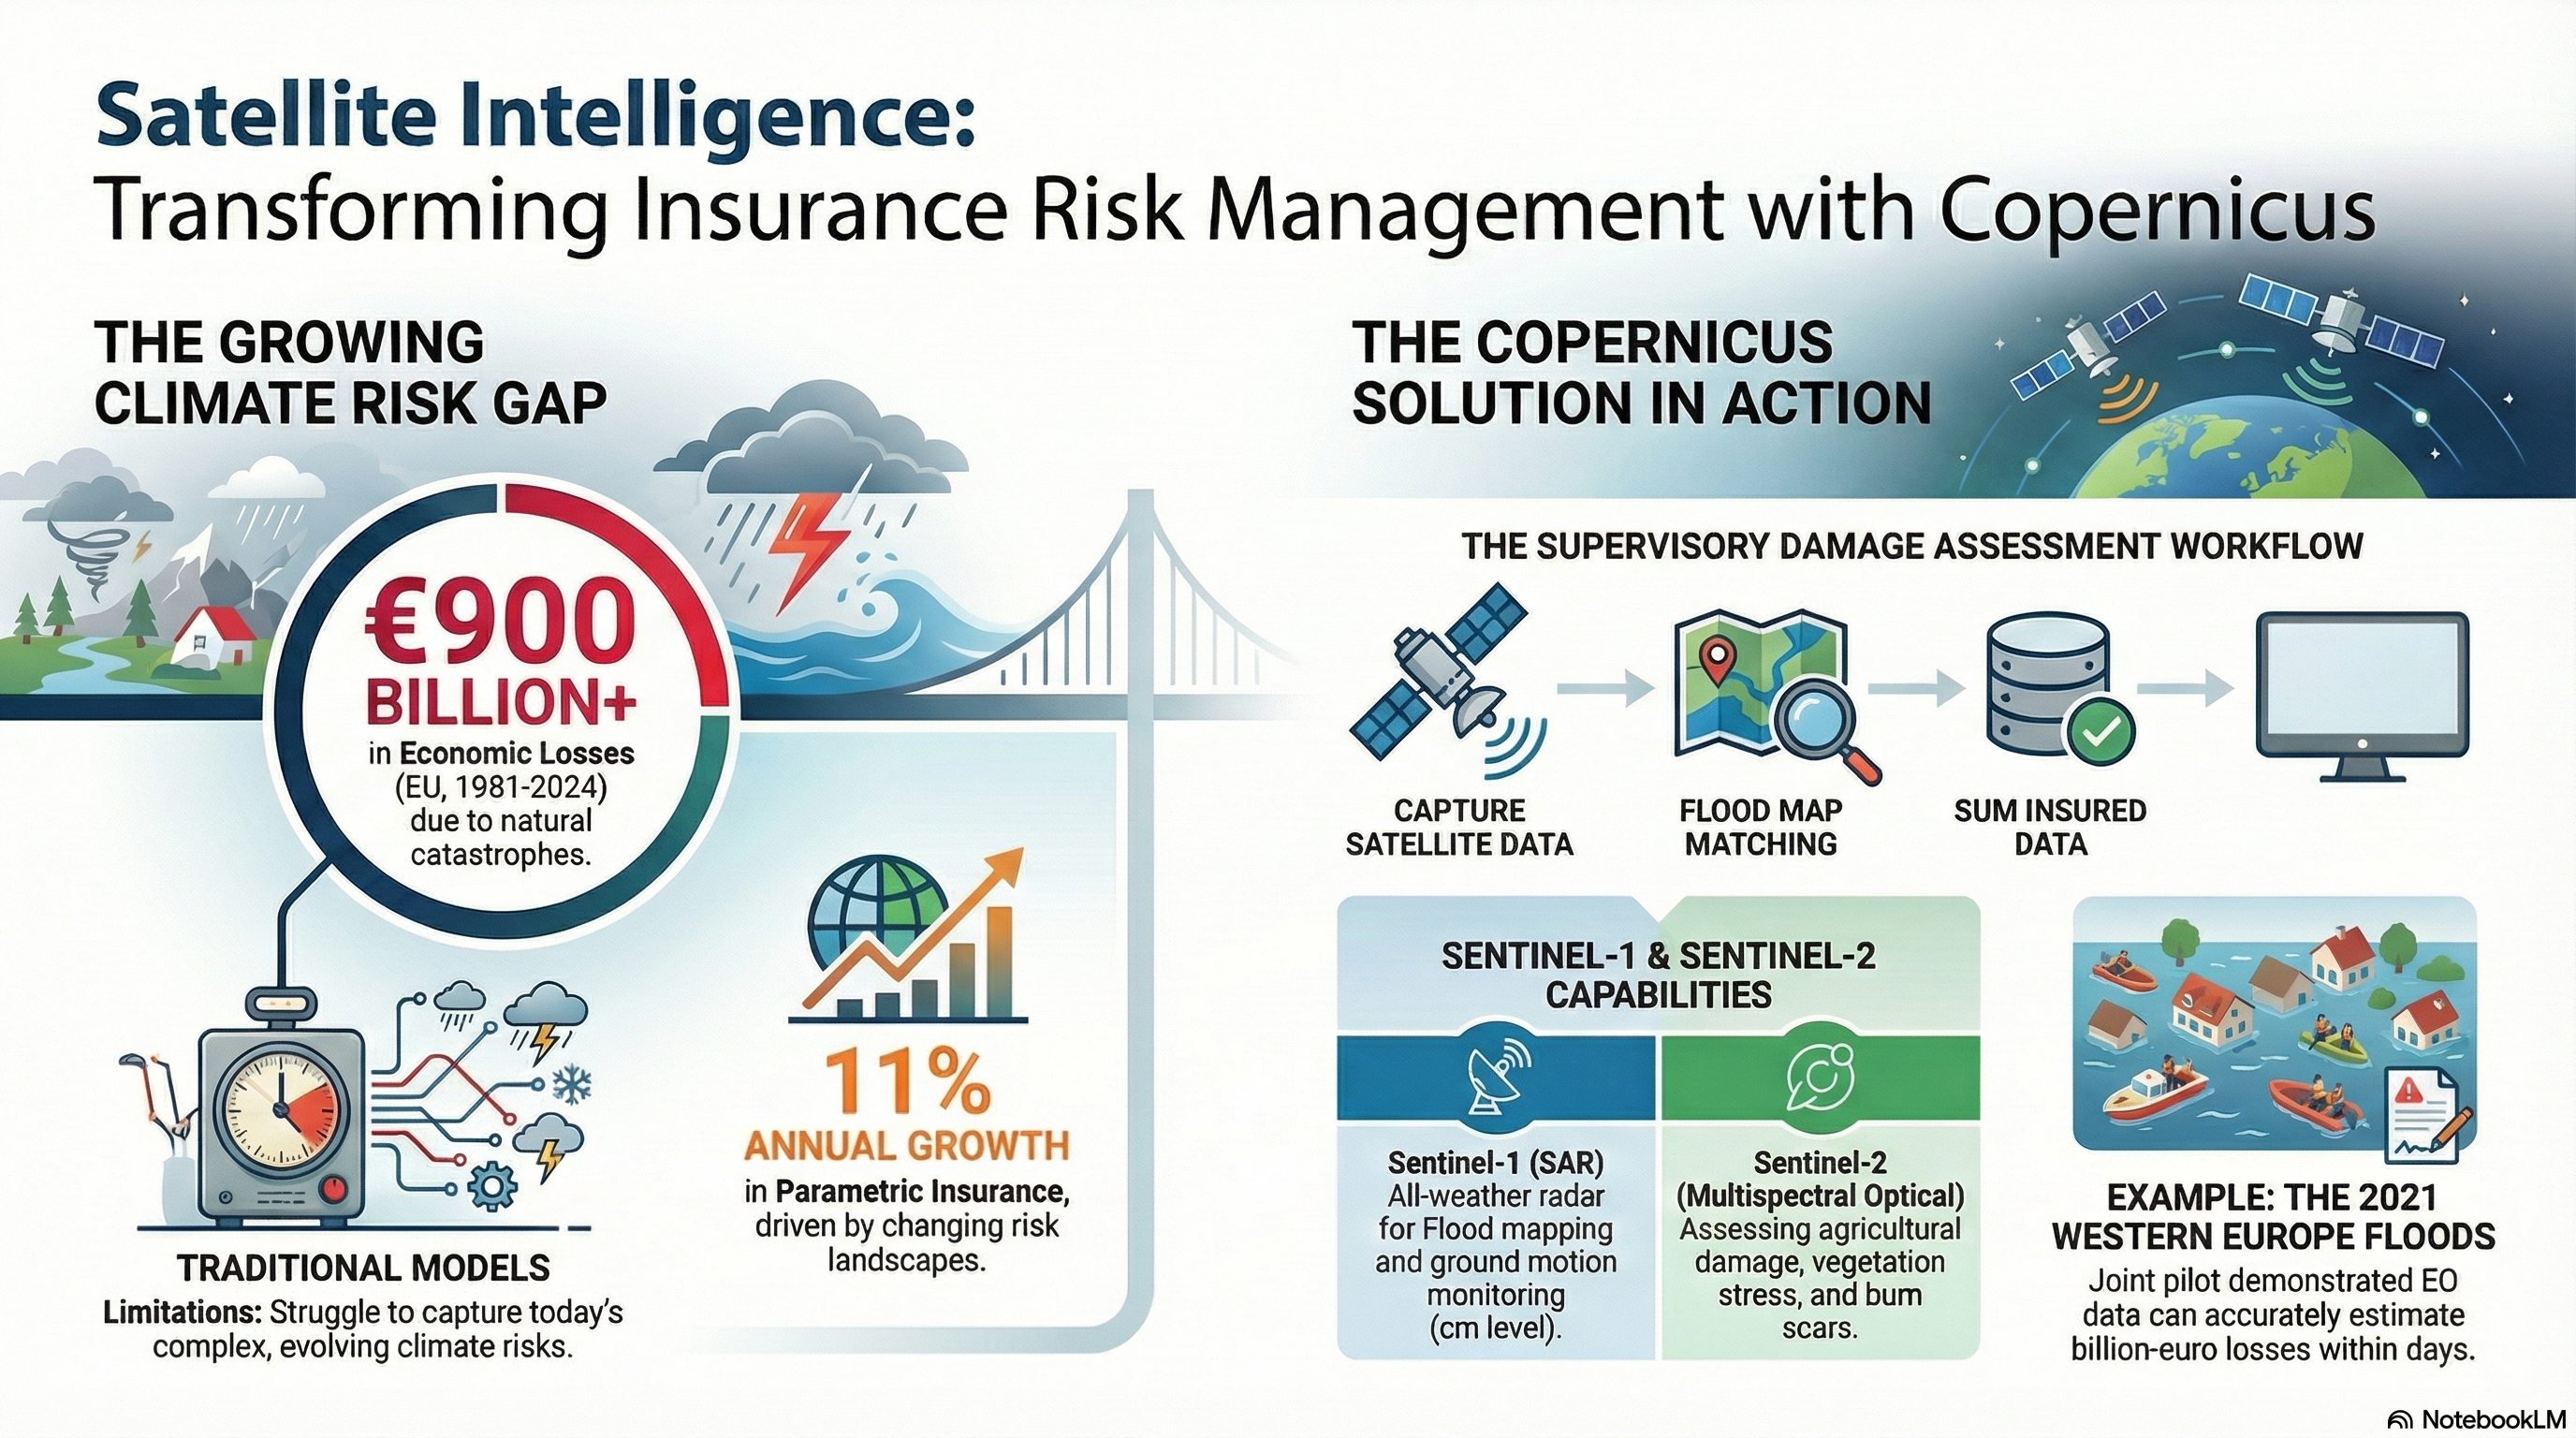
The economic landscape of Europe is increasingly defined by the intensifying frequency and severity of climate-related disasters. According to the white paper, direct economic losses from natural catastrophes in the European Union exceeded €900 billion between 1981 and 2024, with a significant portion of this impact occurring in the last four years. This shift is particularly critical given that the report cites research indicating over half of the global GDP is dependent on ecosystems and the services they provide.
The authors identify the 2021 Western and Central Europe floods as a pivotal turning point for risk management requirements. These floods resulted in more than 200 deaths and over €50 billion in economic losses, making it the world's costliest flood event. The report suggests that such catastrophes demonstrate the limitations of the "traditional approach," which relies on historical data and probabilistic modelling. Instead, the paper advocates for a "forward-looking" approach utilizing Earth Observation (EO) data to manage interconnected climate risks. Recent operational examples cited in the paper, such as the monitoring of catastrophic wildfires in Portugal (August 2023), illustrate the necessity of this transition toward real-time spatial intelligence.
2. Core Technical Capabilities: The Copernicus Sentinel Constellation
The technical foundation for this shift is the EU's Copernicus Sentinel constellation. The white paper details how the integration of different sensor types allows for a comprehensive view of environmental perils. For instance, the report highlights the 2024 Valencia flooding as a case where Synthetic Aperture Radar (SAR) provided critical inundation footprints despite weather conditions that would obstruct other sensors.
Attribute | Sentinel-1 | Sentinel-2 |
Sensor Type | Radar (C-band SAR) | Multispectral Optical |
Resolution | ~20m ground resolution | 10m resolution |
Revisit Frequency | Weekly routine revisits | 5 days (two-satellite configuration) |
Primary Insurance Applications | Flood mapping, ground motion monitoring (centimetre level), and landslide risk. | Built-up areas, vegetation stress, agricultural damage, and burn scars. |
The report also identifies secondary Copernicus services that provide refined data products for the sector. The Copernicus Land Monitoring Service (CLMS) contributes high-resolution layers such as CORINE land cover and the Urban Atlas. Simultaneously, the Copernicus Emergency Management Service (CEMS) provides specialized "Rapid Mapping" during active disasters and "Risk & Recovery mapping" for post-event assessment.
3. The Business Case for Insurance Supervision and Underwriting
The white paper identifies several key drivers for the uptake of EO data, noting that while the parametric insurance market is a primary driver, the technology is also utilized in agriculture, natural resources, and infrastructure management. Market projections cited in the report indicate that EO-driven parametric insurance is growing at a rate of 11% annually, presenting significant revenue opportunities for industry participants.
From a supervisory perspective, the paper argues that EO data offers a "strategic sovereignty" case by reducing the insurance sector's dependence on proprietary third-party providers. By providing a high-resolution, objective view of risk, EO data helps firms avoid the dual hazards of miscalculating capital reserves:
- Underestimation: Leading to insufficient reserves and unexpected solvency shocks.
- Overestimation: Resulting in excessive capital tie-ups and missed business opportunities.
4. Regulatory Integration and the EU Policy Framework
The authors link the utilization of EO data directly to several central EU policy initiatives. The white paper frames spatial data as a tool for ensuring compliance with transparency and risk management mandates. The relevant frameworks include:
- Solvency II Directive: Governance of capital requirements and risk-based supervision.
- SFDR & CSRD: Sustainability disclosures and corporate reporting requirements.
- EU Taxonomy: Framework for defining sustainable economic activities.
- EU AI Act: Regulation of advanced analytics in "high-risk" insurance applications.
The report emphasizes that the EU AI Act specifically demands robust governance and human oversight for high-risk applications. According to the authors, Copernicus data supports these requirements by providing an open, auditable infrastructure with built-in quality assurance, allowing supervisors to verify the data lineages used in AI-driven models.
5. Analysis of the EUSPA-EIOPA Proof of Concept (PoC)
To demonstrate the maturity of these technologies, the paper details a joint pilot project focusing on the July 2021 flood event. Flood monitoring was selected as the most mature application because of the cloud-penetrating capability of Synthetic Aperture Radar (SAR), which allows for mapping inundation during peak event windows.
The methodology followed a specific technical workflow to move from raw data to supervisory insights:
- Input Collection: Integration of post-disaster footprints (Copernicus EMS Mapping or GloFAS GFM) and pre-disaster GloFAS forecasts.
- Flood Extent Mapping: Refinement of satellite footprints for urban contexts and terrain.
- Exposure Assessment: Matching flood extent to land cover data (Copernicus CORINE).
- Damage Assessment: Calculating impacts at the NUTS-2 level using the JRC's global depth damage approach combined with "sum insured" data.
In the Belgium case study, the PoC estimated insured losses between €1.03 billion and €1.17 billion, compared to the industry benchmark of €2.20 billion. The paper provides three methodological reasons for this delta:
- Market View Percentage: The pilot utilized a sub-sample of insurance companies representing approximately 70% of the market view.
- NUTS-2 Spatial Distribution: Uniform exposure estimations at the NUTS-2 level failed to capture the true spatial concentration of insured assets.
- Localized Loss Drivers: Standardized damage functions did not fully reflect extreme, localized impacts or sector-specific drivers captured in actual claims data.
6. Identified Limitations and Strategic Implementation
While the technology is mature, the white paper acknowledges several operational obstacles. Technical limitations include atmospheric interference for optical sensors, revisit cycle constraints, and the need for high-resolution data in dense urban environments. Furthermore, the report notes that implementing these systems requires significant CAPEX and OPEX investments for data processing, analytics, and specialized technical expertise.
The authors propose a "Way Forward" for the industry based on four pillars:
- Data Lineage: Implementing rigorous controls and model risk management.
- Shared Benchmarks: Establishing open EO benchmarks at the NUTS-2 level for post-event assessments.
- Supervisory Guidance: Incorporating EO data as a credible reference in official guidance.
- Proportional Scaling: Expanding adoption through targeted pilots and proportional implementation for smaller firms.
7. Conclusion: The Future Toolkit of European Supervisors
The white paper concludes that Earth Observation has become a "foundational capability" for modern insurance supervision. The authors maintain that EO is intended to complement traditional catastrophe models, specifically by enhancing the "forward-looking view" required for the Own Risk and Solvency Assessment (ORSA).
The report's final assessment suggests that the necessary infrastructure and validated methods for EO integration already exist. According to the paper, the path toward a more resilient European insurance market now depends on the disciplined integration of these satellite-based insights into standard supervisory and underwriting processes.