EBA: The European banking sector enters period of geopolitical uncertainty from a position of strength
10 Years of Resilience: 4 Surprising Takeaways from the 2025 European Banking Risk Report
1. Introduction: The Decade of the Fortress
The landscape of European banking has undergone a radical structural transformation since 2014. A decade ago, the sector was still navigating the long shadows of the sovereign debt crisis, characterized by fragile balance sheets and a mountain of legacy exposures. Today, the data suggests a complete paradigm shift. As we dissect the European Banking Authority (EBA) Q4 2025 Risk Dashboard, we must ask: is our money actually "safer" than it was ten years ago? The evidence suggests that the European banking system has spent the last decade evolving into a veritable fortress. However, as any analyst knows, a fortress is only as strong as its weakest gate, and the 2025 data reveals a sector where strength is impressive but geographic and institutional divergence remains a persistent reality.
2. Takeaway #1: The Unstoppable Rise of the Capital Fortress
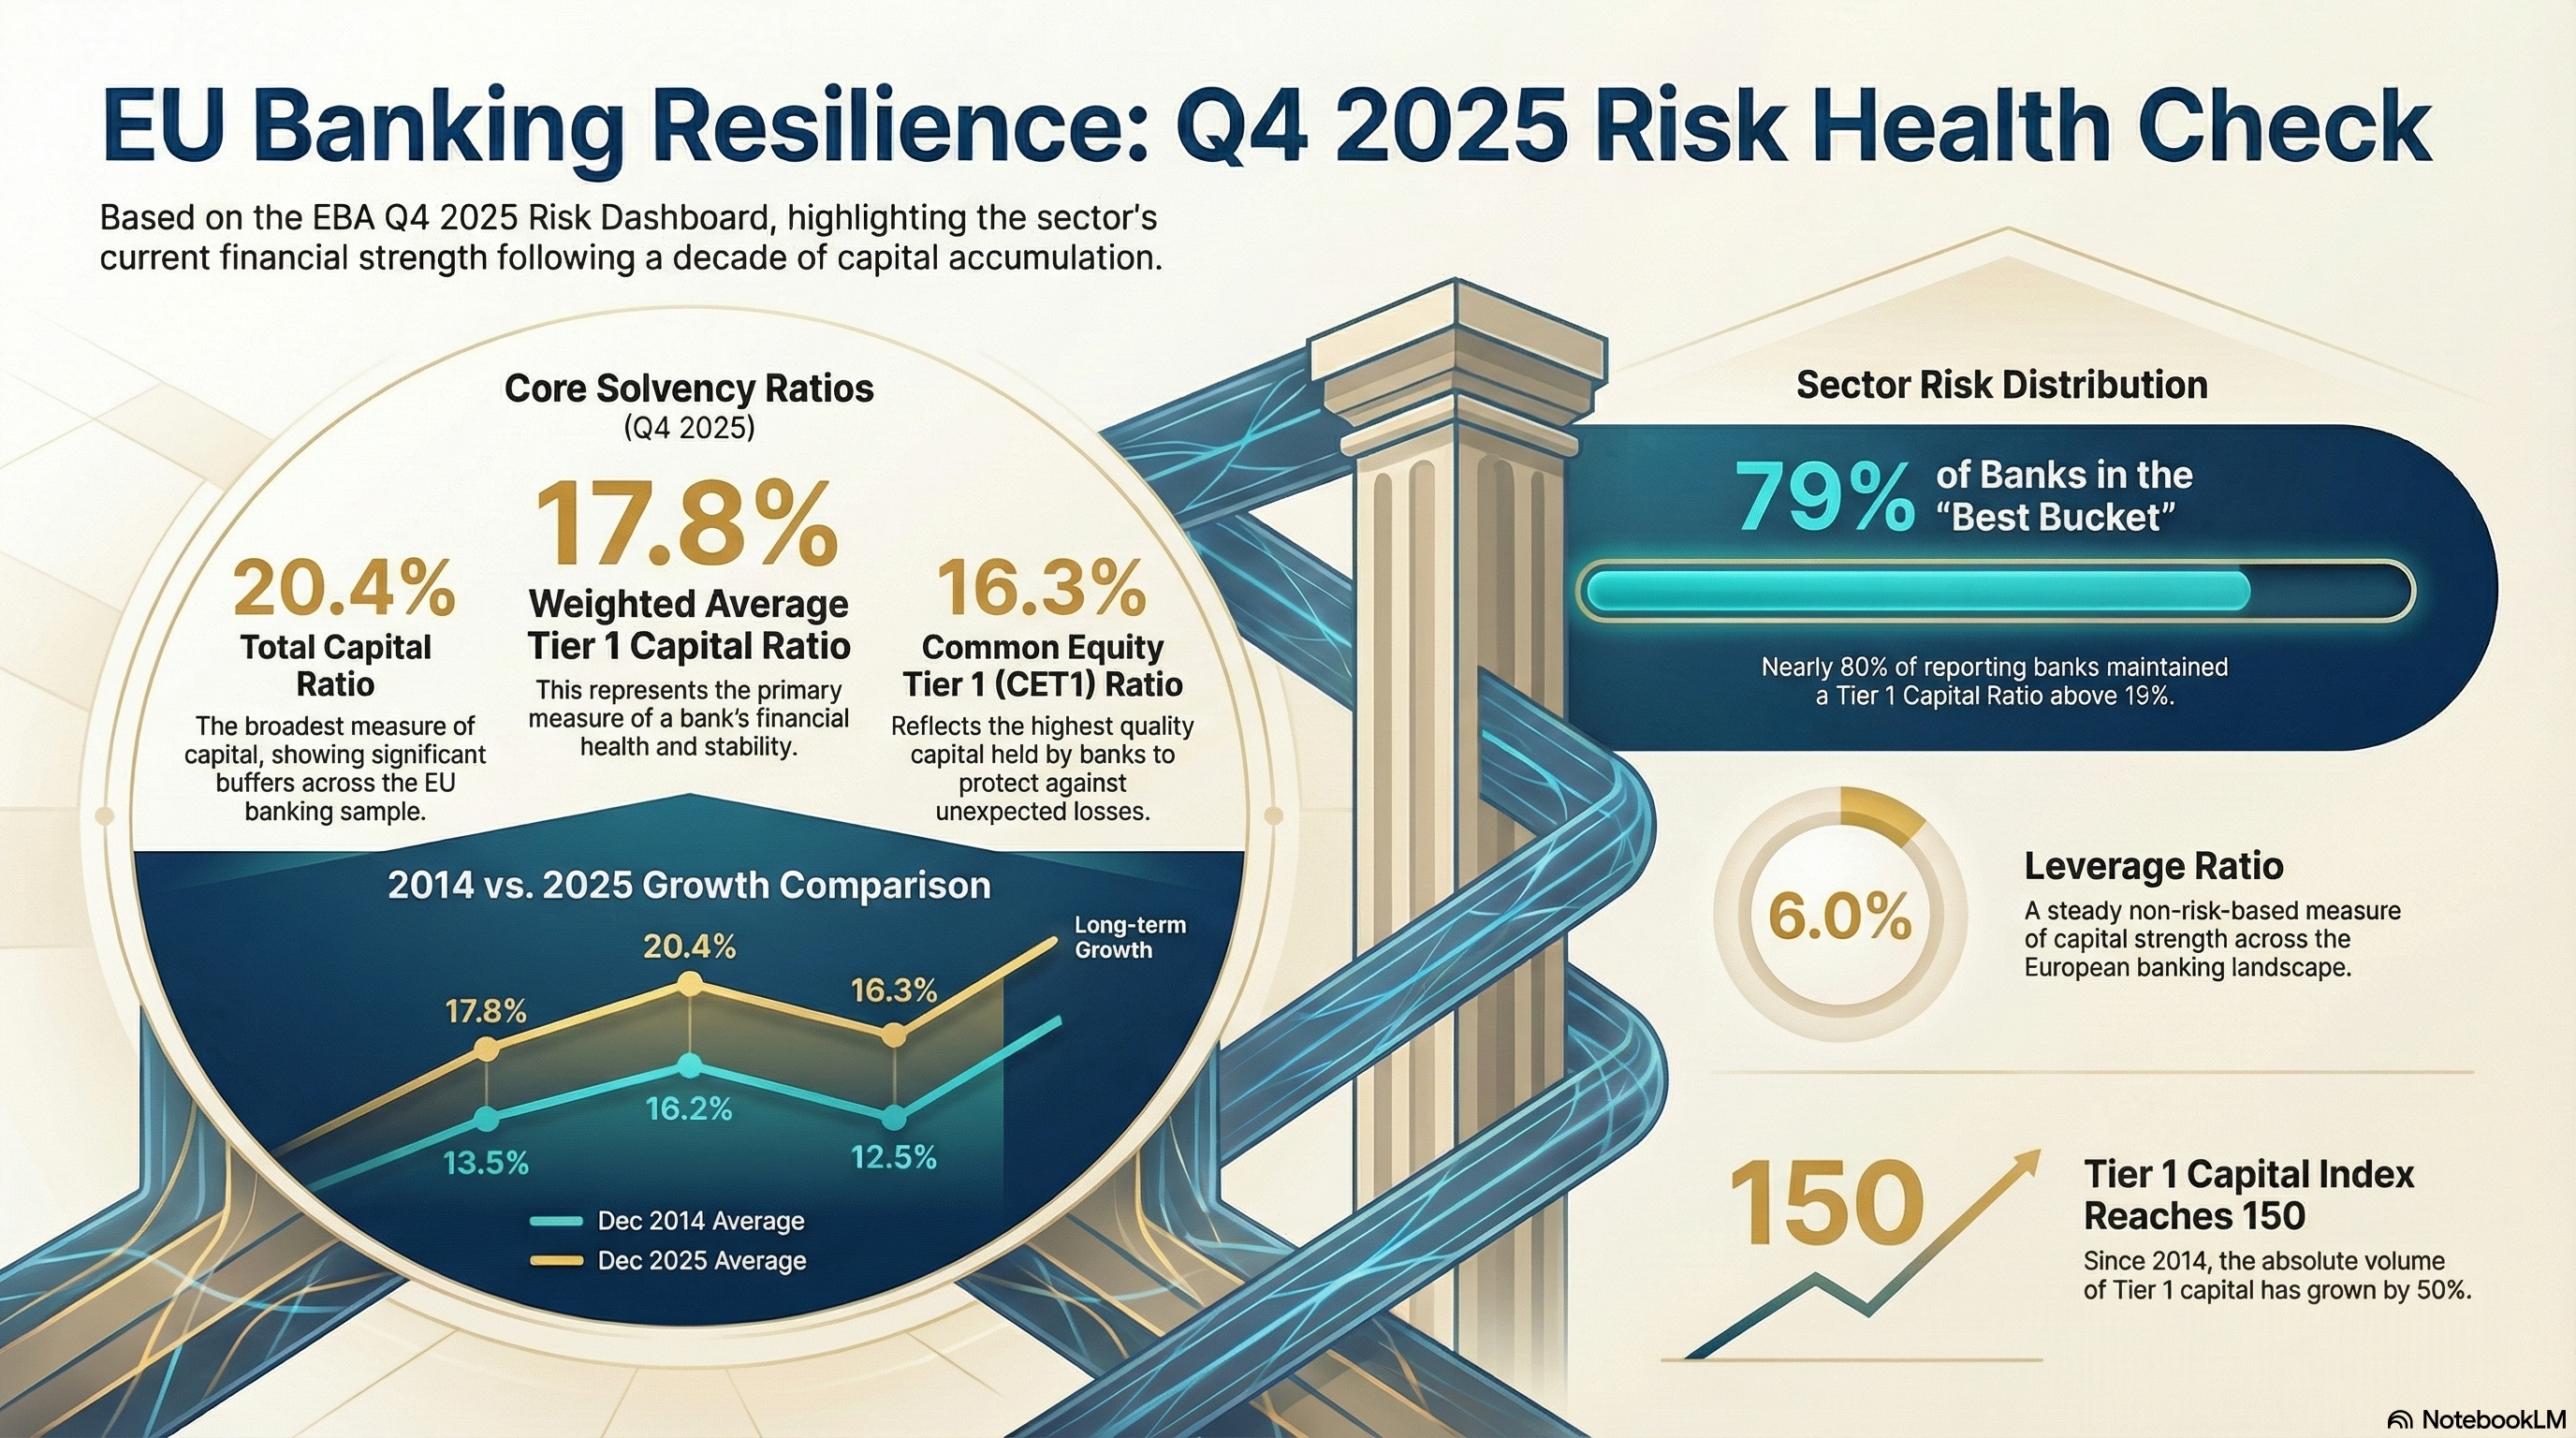
The most vital metric of banking health, the Tier 1 capital ratio, has seen a decade of relentless upward momentum. In December 2014, the weighted average for European banks stood at 13.5%. By December 2025, that figure reached 17.8%.
This 4.3 percentage point increase is not merely a statistical improvement; it represents a fundamental de-risking of balance sheets. This surge in loss-absorption capacity was not accidental but was largely legislated into existence through the transitional arrangements specified in the Capital Requirements Regulation (CRR) and Basel III implementation. By aggressively strengthening their solvency margins, European banks have moved from a period of existential vulnerability to a state of high-level stability, better positioned to weather macroeconomic volatility than at any point in the post-crisis era.
"The Tier 1 capital ratio has climbed steadily for over a decade, reaching 17.8% by the end of 2025, signaling a European banking sector that is more cushioned against shocks than ever before."
3. Takeaway #2: The "Bad Loan" Crisis is a Shadow of its Former Self
The dramatic reduction in credit risk is perhaps the most visible victory of the last decade. In 2014, non-performing loans (NPLs) were a systemic threat, with the weighted average ratio hovering near 6.5%. Today, that crisis has been provisioned and legislated into submission.
Structural De-risking The weighted average NPL ratio has plummeted to approximately 1.8% as of December 2025. This reflects a transition toward significantly improved credit underwriting standards across the continent. Banks are no longer just "picking winners"; they have implemented more disciplined risk-management frameworks that prevent the accumulation of toxic assets.
Asset Quality Excellence The EBA heatmap provides the most compelling evidence of this shift: 67.6% of the reporting institutions now sit in the "best bucket," maintaining an NPL ratio below 1.5%. Only a negligible 0.7% of the sector remains in the "worst bucket" (>4%), a stark contrast to the double-digit figures seen in several member states a decade ago.
4. Takeaway #3: Medium-Sized Banks are Punching Above Their Weight
While the general public often equates "too big to fail" with "most secure," the 2025 solvency data by size class tells a more nuanced story. Medium-sized banks are frequently maintaining more robust capital positions than the systemic "Large" giants.
The data for December 2025 highlights a clear solvency advantage for the medium-tier:
- Tier 1 Capital Ratio: Medium-sized banks boast a ratio of 19.0%, significantly outperforming Large banks, which sit at 17.1%.
- CET1 Ratio: The same trend holds for the highest-quality capital, with Medium banks at 17.6% compared to 15.4% for Large institutions.
This "size-class premium" is surprising to those who assume the largest banks are the most heavily capitalized. From an analytical perspective, this suggests that medium-sized players often benefit from less complex asset structures and more conservative, localized lending models that prioritize high solvency margins over the aggressive leverage sometimes found in global systemic players.
5. Takeaway #4: The Map of Stability is Highly Uneven
While the EU/EEA weighted average for the Total Capital Ratio is a robust 20.4%, this figure masks a significant geographic "dispersion." The map of European banking risk remains a patchwork of high-performers and systemic laggards.
The concept of dispersion highlights the distance between national banking sectors and the EU average. While the system is stable in aggregate, the delta between the top and bottom of the list remains wide:
- The Leaders: Cyprus (CY), Malta (MT), and Luxembourg (LU) dominate the rankings, with weighted average Total Capital Ratios reaching toward 30% or higher.
- The Laggards: Conversely, Poland (PL), Spain (ES), and Hungary (HU) represent the lower end of the spectrum. These nations all sit below the 18% mark, trailing the EU average of 20.4% by a significant margin.
This geographic divide serves as a reminder that banking risk in Europe is never purely a continental story; it is influenced heavily by local regulatory environments and national economic cycles.
6. Conclusion: A Look Toward 2026
The Q4 2025 Risk Dashboard documents a historic milestone: the European banking sector has finally transitioned from a decade-long period of recovery to a new era of sustained, high-level stability. The transition from 13.5% to 17.8% Tier 1 capital marks the successful fortifying of the system against external shocks.
However, as we enter 2026, the primary challenge for the sector changes. We have moved beyond the "bad loan" era and the "capital shortage" era. The new frontier for regulators and analysts is the risk of stagnation or a return to lax standards in a search for yield.
With capital buffers at decade-long highs and bad loans at record lows, is the biggest risk to the system now the complacency of its own success?